The PC narrative – as propagated by the main stream media (MSM) – is frequently untrue.
This can be visualized better with a graph.
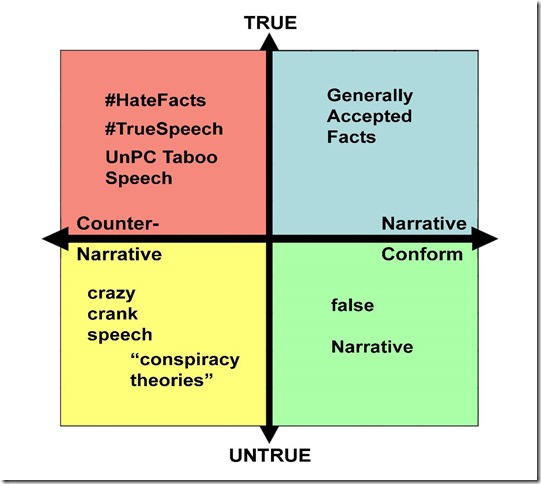
We graph narrative vs truth,
more precisely
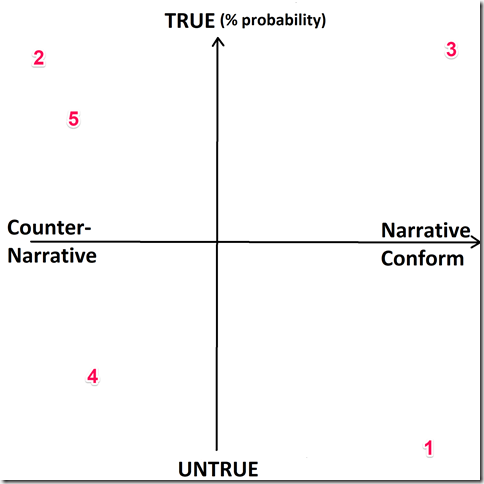
(% narrative conformity) vs. (% likelihood of being true)1 * 2 * 3
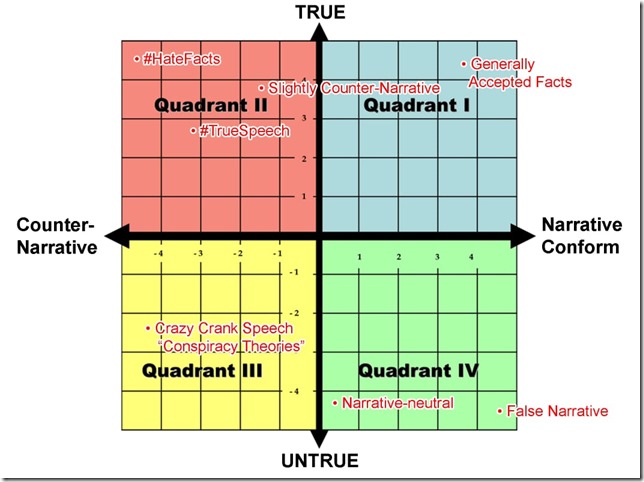
The left upper half (quadrant 2) contains the omitted taboo truth.
True but violates the PC Left narrative and thus must not be told.
Truth is expressed as %probability, which is highly subjective. If something is true but needs major study and analysis, we put it as lower probability.
4- 1 false narrative. 5
- 2 #TrueSpeech. #HateFacts: It opposes the narrative, violates taboos, but is true. “Extreme right wing” sites (vdare.com) and politicians (AfD in Germany) tell the truths but get ostracizes and the normal citizen is told to ignore the “racist” sexist facts told there. Inequality Taboo, the lie that destroys the world
- 3 uncontested facts (conforms to narrative and is true). This is where the MSM can be trusted to mostly do correct reporting.
- 4 Crank speech and real conspiracy theories. It seems untrue and also opposes the narrative. “I was abducted by aliens”
- near 6 narrative neutral and true “the sun did rise this morning”
- 7 narrative-neutral but false : the sun did NOT rise this morning (needs to be marked near “untrue” label. )
FOOTNOTES
-
This is quite subjective and disputable
Even for well established scientific facts like IQ and crime differences between races, we only insist that there is a potential theory that must not be omitted. We accept this being listed as a low likelihood or even slightly negative likelihood. As long as its existence gets disclosed.
Established simple facts (“the assailant was black”)
are 100% likely to be true and 50% counter-narrative.
There is worse, closer to 100% counter narrative:
a book by Colin Flaherty, or a post by Paul Kersey at unz.com showing dozens of instances of black murder
-
This is a nicer way to draw, we will update our drawings
(The following has already been removed from
http://www.webquest DOT hawaii.edu/kahihi/mathdictionary/Q/quadrant.php)
-
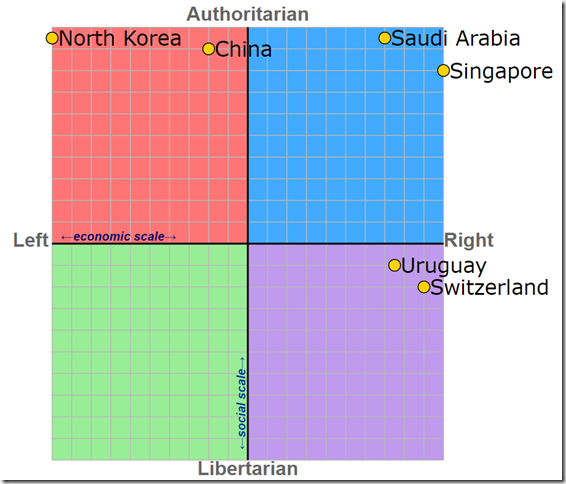
For an analogous x, y graph, see the political compass
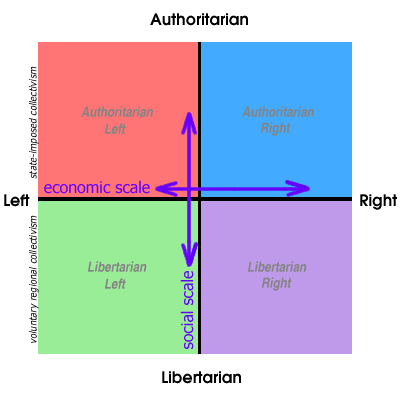
- our old graph, we are saving just for completeness
Scientific honesty: tell the WHOLE truth, nothing hidden: FULLY…
“Blacks have lower income than Whites in the USA.
“systemic racism” was a recent invention, a dishonest, desperate attempt to distract from the fact that all other explanations for race differences (like real racism, lower black self esteem etc.) have been disproven
